
Accounting Ratios
Measure the overall health of a company

Updated:
May 29, 2023Accounting (or financial) ratios are important metrics used in the finance world. Financial ratios measure the overall health of a company. The ratios calculate the liquidity, leverage (debt level), efficiency, profitability, and market value of a company.

Ratio metrics are derived from a company's financial statements to provide valuable information about performance to an investor, bank, company, or owner.
NOTE
Accounting ratios are calculated yearly or quarterly.
What is an Accounting Ratio in simple terms?
Express the relationship between two data points in a company's financial statement.

To calculate, take data points from any of the statements to yield a ratio that indicates information for a certain performance point of a company.
In much simpler words, accounting ratios paint a picture of a company's health:
- Where did the company come from (past performance)?
- How is the company currently performing?
- How is this company expected to perform in the foreseeable future?
- What are the strengths and weaknesses of this company?
- How much cash does it have? Can it pay back the debt?
- Does it generate good profits for its shareholders? How much?
These are the essential key questions people ask before investing in any business. That is why various ratios are used [discussed down below]. The accounting ratios and their calculation formulas provide a strong understanding of:
- When and why to use a specific ratio.
- Whether a company is performing well or not.
- A brief insight into how an investor, bank, or company thinks.
- How vital the ratio is in gauging a company's health.
NOTE
Remember, it may get a little more complicated when analyzing and quantifying large Fortune 500 companies or major corporations.
Understanding Accounting Ratios

An accounting ratio compares two data points from any of the company's financial statements, such as:
The ratios are used to check the fundamentals of a company and provide further information about the performance over a quarterly period or fiscal year.
Analyzing accounting ratios is crucial in gauging how strong a company is. From the outside, a company may sometimes look strong and growing. However, its financial health may be weak, resulting in turbulent times for all its stakeholders.
These ratios show the strong points and weak points of a company:
- Where is the company profitable? Why is the other company more profitable?
- Where does the company need more improvement?
- Does the business have good control of its expenses?
- What returns can I get from investing in this company as a shareholder?
- How well does the business manage its assets?
- Can the business pay its debts on time? Will it have cash left over?
- What type of company is it? (For example, Amazon is a company that values growth over profitability. So the accounting ratio that measures profitability may mislead a buyer into thinking Amazon is not a healthy company when it is quite the opposite.)
Answering questions through the help of accounting ratios can help in analysis which helps a company to restructure itself by acquiring newer products, improving its management strategy, and revising its operational systems.
These help businesses become operationally efficient and profitable for their shareholders.
Financial ratios are often used to compare Company A to Company B. Important stakeholders usually make these comparisons of a business, such as - investors, creditors, etc.
This helps companies identify loopholes and weak points in their business by comparing themselves to competitors and taking remedial action to improve the business's overall financial health.

This is also where customer loyalty comes in. Companies want to establish a strong relationship with their first-time customers. They do so by providing value to lock them long-term and build a community base.
An in-depth detailed accounting analysis can be complex, but calculating accounting ratios are not. Financial ratios integrate data points to one another, which yields a ratio. This is calculated by dividing any two-line items found on the 4 financial statements.
NOTE
The ratio provides a quick answer to an owner, investor, or business without them having to see all the detailed reports.

Sign Up for our Free Excel Modeling Crash Course
Begin your journey into Excel modeling with our free Excel Modeling Crash Course.
Types of Accounting / Financial Ratios
Brief: Accounting / Financial ratios are used to perform quantitative analysis to assess a company's health based on its: liquidity, debt levels (leverage), growth, margins, profitability and rates of return (RoR), valuation, and much more
Accounting or Financial Ratios can be broken into 5 simple groups:
Group 1: Liquidity Ratios
A) Current Ratio
B) Acid-Test Ratio
C) Cash Ratio
Group 2: Leverage (debt) Ratios
A) Debt Ratio
Group 3: Efficiency Ratios
A) Asset Turnover Ratio
B) Inventory Turnover Ratio
C) Days Sales in Inventory Ratio
D) Accounts Receivable Turnover Ratio
Group 4: Profitability Ratios
B) Operating Profit Margin Ratio
C) Net Profit (NP) Ratio
D) Return on Assets (ROA) Ratio
E) Return on Equity (ROE) Ratio
Group 5: Market Value Ratios
A) Dividend yield ratio
B) Earnings per Share (EPS) Ratio
C) Price-Earnings (PE) Ratio
Note
Where to find some of the determinants used in the ratios formulas:
- Current assets and current liabilities found on the balance sheet
- COGS and Inventory found on the balance sheet
- Shareholder's equity found on the balance sheet
- Debt and Assets found on the balance sheet
- Revenue found on the income statement
- Operating income found on the balance sheet
- Gross Profit found on the income statement
- Accounts receivable and net credit sales found on the balance sheet (or general ledger).
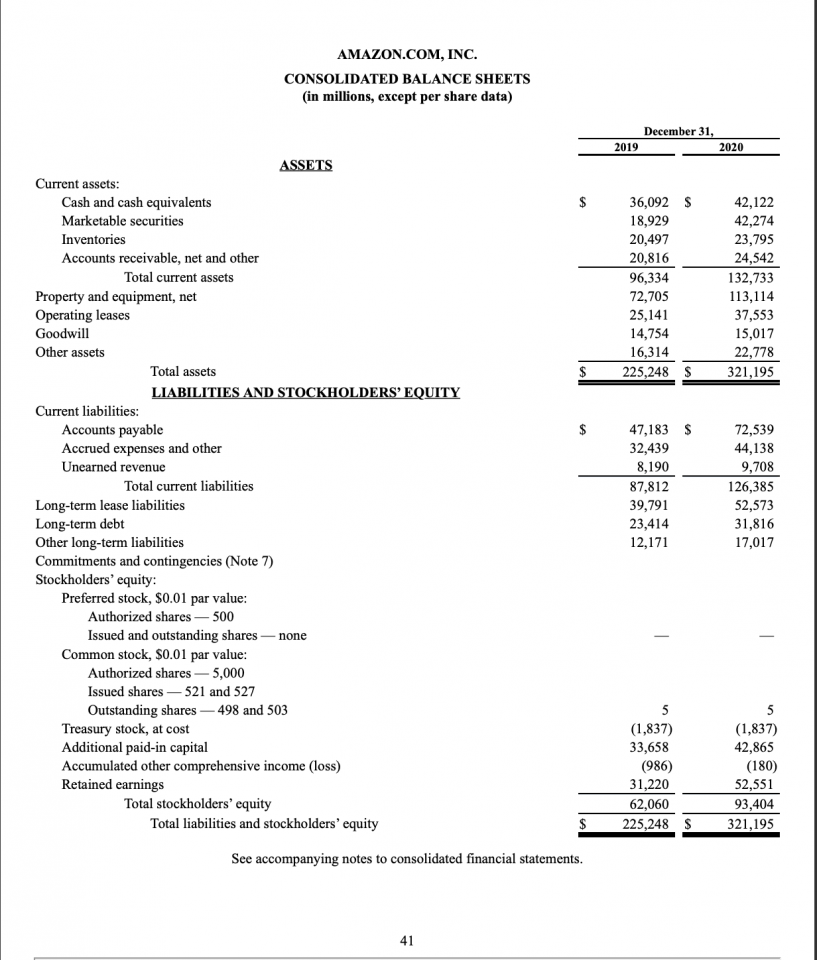
*Below is a photo example of Amazon's balance sheet. For all three other Amazon financial statement examples, click here. To know more about Financial Statements, check this out.
Group 1: Liquidity Ratios
Brief: Liquidity Ratios are financial ratios that measure the ability of a company to pay back its short- and long-term obligations. Common liquid ratios include:

A) Current Ratio: measures the company's ability to pay off its short-term liabilities with its current assets.
Formula:

- The current ratio reveals the financial health of a company
- Current ratio shows how it can maximize liquidity of its current assets to settle debts and payables.
B) Acid Test ratio: measures the ability of a company to use its quick assets (like cash) to pay off short- and long-term liabilities.
Formula:

- Acid-test ratio is used because of simple logic: inventory is slow to move and cannot be converted into cash quickly; inventory may take time to sell.
- If the inventory were to be sold immediately, it would be sold at a huge discount which is not profitable to the carrying cost on the balance sheet.
C) Cash Ratio: measures the ability of a company to pay off short-term liabilities with cash or cash counterparts
Formula:

- The cash ratio is a stricter measure because only cash and cash counterparts are used in the calculation (the company's most liquid assets).
- Cash counterparts are assets that can be turned into cash quickly. Examples include money market instruments, savings accounts, T-Bills, stocks, and bonds.
- A Ratio >1 means that the company can pay off current liabilities with cash and have cash remaining
- Creditors like banks desire a high cash ratio, showing that a company can pay off its debt.
- Ideally, a ratio between 0.5 – 1 is preferred; anything lower is not.
Group 2: Leverage (debt) Financial Ratios
Brief: Leverage (debt) ratios measure the amount of capital coming from debt. The ratios are used to calculate how much debt a company has borrowed. Common debt ratios include:

A) Debt Ratio: measures the number of assets a company has that come from debt.
Formula:

- It is commonly used by creditors, investors, and analysts to determine a company's risk level.
- Higher ratios = riskier to invest and provide loans; this company could default in the future, which means not being able to pay back the debt.
- Creditors like to determine the amount of debt of a company and its ability to repay its debt. It is used to determine if creditors are willing to extend more loans to the company.
- Investors like to make sure a company is solvent or can meet its current and future obligations. This allows a company to generate a return on investment (ROI).
A Ratio equal to one (=1) means a company has the same amount of assets and liabilities. So, it is highly leveraged (in debt).
A ratio greater than one (>1) means a company owns fewer assets and more liabilities. Thus, it is leveraged (in debt) and risky to invest and lend to.
A ratio less than one (<1) means the company owns more assets than liabilities and can meet obligations by selling assets. They will have remaining money and are less risky. Thus, a safer investment.

Everything You Need To Master Excel Modeling
To Help You Thrive in the Most Prestigious Jobs on Wall Street.
Group 3: Efficiency Ratios
Brief: Efficiency ratios, a.k.a activity financial ratios, measure how well a company can utilize its assets and resources. Common efficient ratios include:

A) Asset Turnover Ratio: measures the company's ability to generate sales from assets.
Formula:

- Measures the amount of revenue generated by a business compared to its average total assets for the given fiscal year.
- Net Sales is the total amount of revenue (cash or credit) produced primarily by using the main business activity resources of a company.
- The higher the ratio, the better performance of a business. The lower the ratio, the lower the performance on utilizing total assets (inventory, fixed assets like buildings, or receivables).
B) Inventory Turnover Ratio: measures how many times a company can sell and replace its inventory.
Formula:
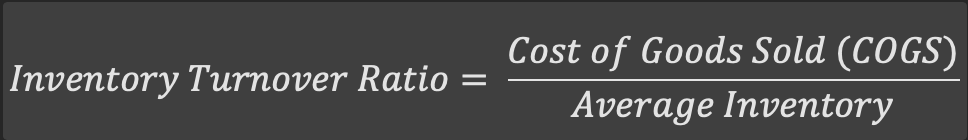
- How fast an inventory sells is a good performance indicator of a company. This shows how well the product meets market demand compared to other competitors.
- A high inventory turnover means that goods sell faster. Consequently, a low inventory turnover means weak sales and excess inventory.
- High turnovers are favored as it means growth and makes storage fees, rent, utilities, insurance, theft, and other misc. costs lower.
C) Days Sales in Inventory (DSI) Ratio: measures the average number of days a company holds an inventory before it is sold to customers.
Formula:

- DSI goes deeper into the Inventory turnover ratio by giving the exact days it takes for an inventory to be sold and replenished.
- It is one of the measures used to determine the cash conversion cycle, the average days a company takes to convert resources to cash flows.
- Shows creditors and investors liquidity of a business
- The longer the inventory is held, the longer its cash cannot be used for other operations, hence an unfavorable opportunity cost.
D) Accounts Receivable Turnover Ratio:measures how many times a company can turn its receivables into cash in each period.
Formula:

- Measures the number of times a company converts its receivables into cash.
- A high receivable ratio might mean the company operates more on cash.
- A low receivable ratio might mean a poor collection process, bad credit policy, or that customers are not reliable financially in making back payments.
Group 4: Profitability Ratios
Brief: Profitability ratios measure the ability of a company to generate income relative to its revenues, assets, operation costs, and equity. Common profit ratios include:

A) Gross Margin (GM) Ratio: measures how many times a company can turn its receivables into cash in each period.
Formula:

- Shows the percentage of each dollar of revenue the company has retained as gross profit.
- Higher ratio = preferred. There are 2 ways to get higher ratios:
- Purchase inventory at large discounts or find a more competitive supplier.
- Mark up goods at a higher price (of course, relative to the competition).
B) Operating Profit Margin Ratio: measures a company's operating income to its set sales. This ratio determines the operating efficiency.
Formula:

- The operating Margin Ratio is different from the Net Profit Margin ratio (below) as it focuses only on a company's operations and excludes the cost, interest payments, and taxes.
- How efficient is the company at managing expenses?
C) Net Profit Margin Ratio: measures a company's profit from total revenue (in percentage form).
Formula:

- A strong indicator of a company's success is usually shown in percentage form. - Note: High net profit, High Cash Flows -
- Management might reduce long-term expenses like research and development to increase short-term profit. This can yield a high net profit margin.
- This ratio tells us that a company can control its cost and provide products and services at a higher price than its cost.
- 3 ways net profit margin can be high: efficient management, low expenses, and strong pricing.
D) Return on Assets (ROA) Ratio: measures how well a company can use its assets to generate profit.
Formula:

- ROA ratio is used to compare a company's performance between different periods or to compare different companies in the same industry.
E) Return on Equity (ROE) Ratio: measures how well a company can use its equity to generate profit.
Formula:

Investors can use the ROE ratio to see if they are getting a good return on their money.
- A company can evaluate how well they are using the firm's equity. - Note: ROE does not show full risk. A company could be generating profit based on high debt, which boosts ROE.-
Group 5: Market Value Ratios
Brief: Market value ratios evaluate a company's stock share price. Common company market value pricing ratios are:

A) Dividend Yield Ratio: measures the number of dividends that shareholders get in relation to the market value of a share:
Formula:

- Investors use the dividend yield ratio to see if this company aligns with their investment strategy.
- It shows the percentage of dividends for every dollar spent on a stock by an investor.
B) Earnings per share (EPS) Ratio: measures the amount of net income earned for each outstanding share:
Formula:

- EPS ratio shows a company's ability to produce net profits for shareholders. -Note: Higher EPS = Better Profits.-
- Outstanding Share simply means shares of a company with new issues, buybacks, converted, and more.
C) Price-earnings (P/E) Ratio: compares a company's share price and how much earnings the share gets.
Formula:
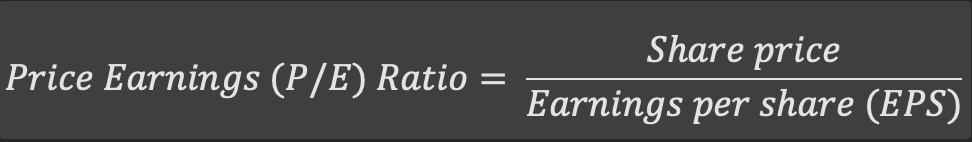
- Investors use this standard ratio to value the company.
- The P/E ratio is important because investors want to know how profitable a company is and how profitable it will be in the future.
- PE ratio shows how much the market values the company and the price you must pay to own it.
How do Accounting Ratios help us?

There are many real-life applications of these ratios. It is not just for accountants or existing shareholders of a business. So many of us like to invest money either in short- or long-term opportunities.
The difference between an intelligent investor and a poor investor is using these accounting ratios and other important information about the company to check if the investment matches their criteria. A naive investor follows YouTube, people, or guesses hoping they get lucky.
But not you. You are better than that. You are an intelligent investor; we have given you the tools needed to succeed.
Let's take a scenario:
Your friend Tim comes and asks you to invest in this "winning company". He says, "[...] just look at the revenue they generate!". Tim says this is a gold investment that can double the returns! Tim is an old-time friend of yours and works as a landscape design consultant.
He has done many great things for society and earns a respectable living. You like Tim but know that he has claimed this in the past, and both of you have lost money.
Now, you analyze the company's financial statements to calculate debt ratios to know how much debt the company took in the short- and long-term. You find that the company is only profitable because of its debt, not because of generating positive cash flow and net profits.
So, you decide not to invest in the company. You win!
Other examples
Let's say you want to start your business. You would use financial ratios to help you budget, identify your strength areas of improvement, and show how much debt to take to grow your business.
Accounting ratios help make better financial decisions as they yield clear-cut answers on whether the investment is worthwhile.
Accounting (Financial) Ratios: Taken in Context

Remember our example from the beginning of this page under the "Understanding Accounting Ratio"? When asking, "what kind of a company is it"?
For example, Amazon is a company that values growth over profitability. So the accounting ratio that measures profitability may mislead a buyer into thinking Amazon is not a healthy company when it is quite the opposite.
Amazon reinvests its income into growth instead of taking profits because of its unique strategy. It is an online retailer which has a large customer base. Therefore, the way to acquire more revenue, in the long run, is by having more customers use their database.
This will attract more sellers and more buyers and allow them to expand globally-which they already have. It is just the business model they operate on, which does not necessarily mean it is a good/bad one. Decide what works for you and the market where you operate in.
Always use detailed reports and further analysis and accounting ratios to make decisions. The metric also help us interpret and understand the internal strategy of a company.
If you'd like more information, with more depth and examples, please see this link.
Key Takeaways
Understanding accounting ratios can help you calculate the health of a company and make you an intelligent investor. They provide insights into many specifics of a company that may otherwise not seem evident on the surface.
- Accounting (or financial) ratios are important metrics used in the finance world. Financial ratios measure the overall health of a company. The ratios calculate the liquidity, leverage (debt), efficiency, profitability, and market value of a company.
- Ratio metrics derive from a company's financial statements to provide valuable information about performance to an investor, bank, company, or owner.
- The metrics are calculated yearly or quarterly.
- They express the relationship between two data points in a company's financial statement: the balance sheet, income statement, statement of cash flows, and statement of shareholder's equity.
- To calculate, simply take data points from any of the statements to yield a ratio that indicates information for a certain performance point of a company.
- Common accounting ratios include the debt-to-equity ratio, the quick ratio, P/E ratio, ROE/ROA ratio, dividend yield ratio, net profit margin ratio, and operating margin ratio.
- Owners use accounting ratios, investors, and banks (creditors) to compare a company's health and companies to determine the best investment option.

Everything You Need To Build Your Accounting Skills
To Help You Thrive in the Most Flexible Job in the World.
Research and authored by Shahrukh Azim Butt | LinkedIn
Free Resources
To continue learning and advancing your career, check out these additional helpful WSO resources:

or Want to Sign up with your social account?