
Earnings Per Share Formula (EPS)
A metric that is used to measure a company's profitability

Updated:
March 25, 2023The Earnings Per Share Formula (EPS) is a metric that is used to measure a company's profitability. It is calculated by taking the company's net income for the period in question and dividing it by the number of shares outstanding at the end of the said period.

It can be presented in dollar terms or as a percentage change compared to the previous period. It is considered among the most important metrics for investors as it allows them to evaluate a company's profitability.
Formula for EPS
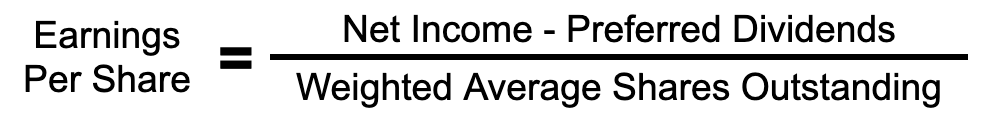
It is calculated from net income by subtracting preferred dividends and then dividing the result by the weighted average shares outstanding. Below is an illustration of the formula:
What is Net Income?
Net income is a company's returns after accounting for all expenses, including interest and taxes. It is added to retained earnings or paid out as dividends. It helps investors understand the absolute amount of profits that are generated by a company.
Net income is calculated by taking total revenue minus the cost of goods sold (COGS), operating expenses, depreciation and amortization, interest, and taxes. It can usually be found on the final line of an income statement.
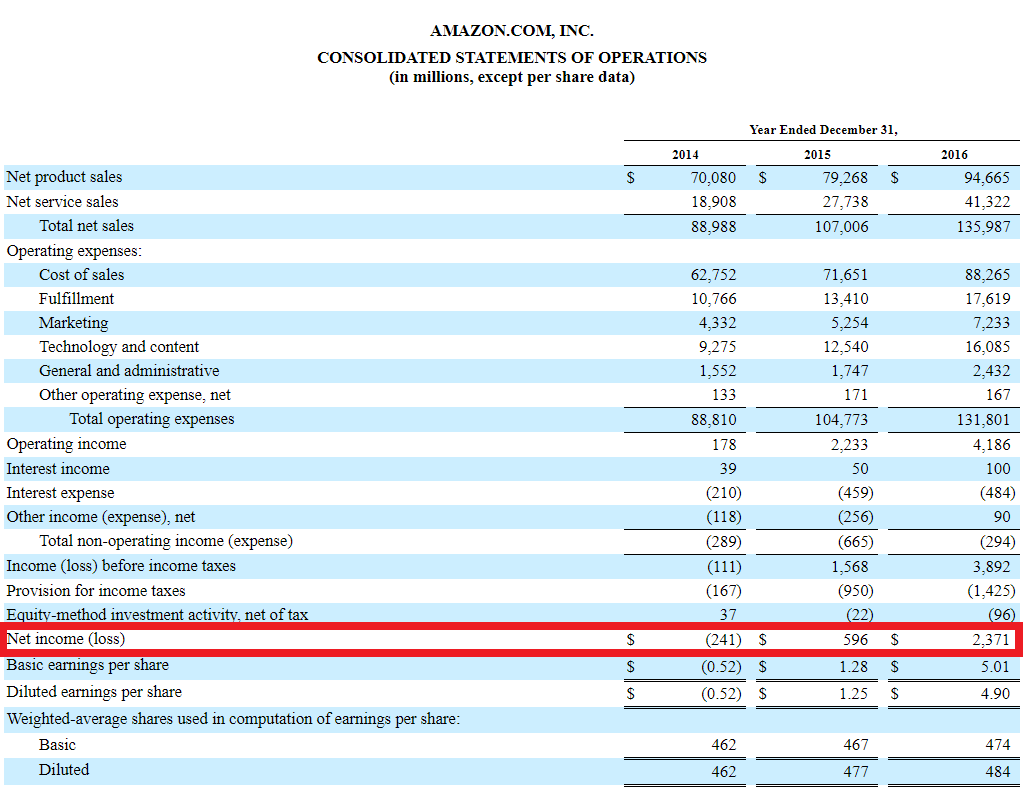
Ultimately, the income statement lays out the calculation of the company's net income.
Here is an Amazon income statement with the net income highlighted in red:
What are Preferred Dividends?
Preferred dividends are those dividends that are issued to preferred shareholders. Preferred shareholders have a higher right of payment than common shareholders. Hence they are paid profits first. As a result, preferred shareholders also usually receive higher dividends than their equity counterparts.
The dividends for preferred stock are typically determined at the time of their issuance.
To find the value of the preferred dividend, multiply the number of preferred shares by par value and by the dividend rate. The amount of preferred shares outstanding is the total number of shares issued by the company.
Par value is the value of the share on which the dividend will be calculated and is usually decided at the time of issue.
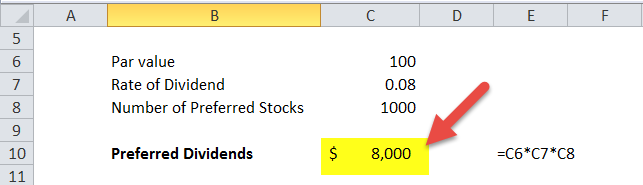
Company X has 1,000 preferred shares outstanding with a par value of $100 per share. They decided to pay an 8% dividend to their preferred shareholders. To determine the total preferred dividend payable, multiply these three values.
The total preferred dividends work out to $8,000. All information to calculate preferred dividends can be found on the balance sheet.
Below is the example of preferred dividends in Excel:
What are the Average Shares Outstanding?
For a publicly-traded company, the average shares outstanding is the number of shares of their stock on the open market, including shares held by investors and restricted shares owned by insiders. The number of shares outstanding can fluctuate for a variety of reasons.
In EPS calculation, analysts use a weighted average of shares outstanding to account for fluctuations over time. Changes in the number of outstanding shares can happen for various reasons, including issuing new shares and repurchasing shares in the market.
After adjusting for changes, you have the new weight average shares outstanding for that period.

The weighted average of shares outstanding is found by first analyzing the number of shares outstanding for each part of the reporting period. Then, as the number of outstanding shares changes throughout the reporting period, the analyst takes a weighted average based on the time each unique value of shares outstanding was valid.
For example, if a company has 500,000 shares outstanding for half of the reporting period and then executes a 2:1 stock split at the beginning of the second half of the reporting period boosting the shares outstanding to 1,000,000, the calculation for weighted average shares outstanding would be as follows:
½ the reporting period x 500,000 shares + ½ the reporting period x 1,000,000
You can find the weighted average shares outstanding in a company's income statement below its net income and EPS calculation.
Where Can You Find a Company's EPS
EPS can be found on a company's quarterly 10-Q or annual 10-k report. It can be found in two places in these reports. First, it will be in the consolidated statement of operations. Next, certain companies will have a section in the account dedicated to EPS.
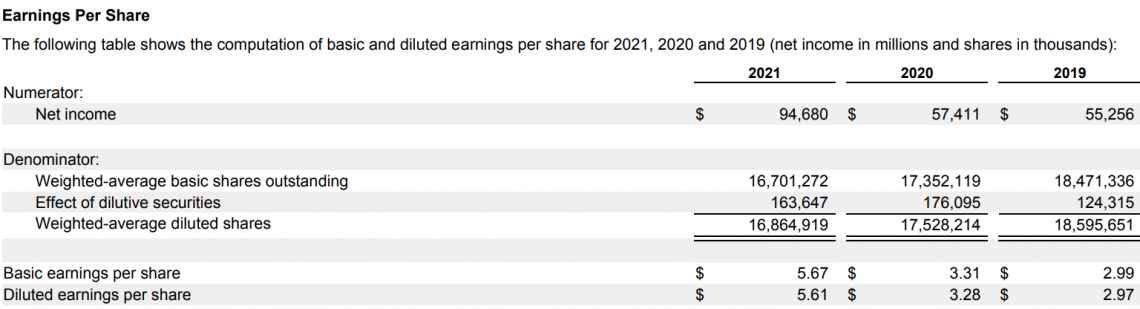
They will list their earnings and all the calculations used in EPS for clarity's sake. Here is an example of Apple's EPS section in their 2021 10-K report:
A company's EPS can also be found on finance websites such as Yahoo Finance.
Example of an EPS Calculation
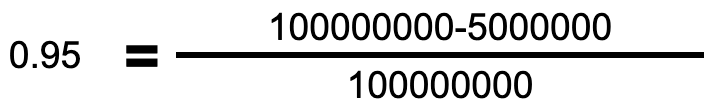
Let's say a company has $100 million in net income, $5 million in preferred dividends, and 100 million shares outstanding.
The first step in an EPS calculation is to subtract t the preferred dividends from net income. This would give you $95 million in the numerator of your calculation. Then you divide the $95 million by the 100 million shares outstanding.
The EPS would be calculated as $0.95 per share. Here is an illustration of that calculation:
If the company had a net income of $50,000, $25,000 in preferred dividends, and 500,000 outstanding shares, the EPS would be calculated as $0.05. This calculation is illustrated here:

How Is Earnings Per Share Formula Used
EPS is a helpful metric for investors because it shows the company's profitability relative to the number of shares in the market. This means that it can accurately depict a company's earnings more accurately than looking at net income.
Investors may use EPS to compare different companies to see how well they are doing relative to each other.
EPS is also used as a financial profitability ratio. Growth in earnings per share is used to assess a company's long-term development and whether or not a company is profitable.

Basic EPS vs. Diluted EPS
The EPS formula calculates how much profit per share the company has earned during a reporting period. But, it's essential to know that there are two different versions of the EPS: Basic and Diluted.
The basic EPS takes into account only the common shares that were outstanding during a given period. Diluted EPS considers all securities that could be converted to common shares.
Because Diluted EPS considers additional security types that could increase the number of shares outstanding, the calculation for earnings per share includes a larger denominator. As a result, diluted EPS has a larger pool of shares and potential shares; the final value in the EPS calculation is smaller than the basic EPS.
Diluted EPS considers all security types that could potentially dilute earnings per share in the future. This means diluted EPS is calculated as if all convertible securities were exercised and options were converted to stock.
Assuming the company has convertible securities, the Diluted EPS will always be lower than a company's Basic EPS.
EPS From Continuing Operations
Due to market conditions, a company may plan to end some business operations. But if the operations are not set to end later, the company will still generate earnings from these discontinued operations. In this case, analysts will calculate EPS only based on the procedures that are continuing with the company.
This is made by subtracting the income from the discontinued operations from the total income.
The EPS from continuing operations helps understand a company's earnings for the future.
Below is the formula for EPS from continued operations:

How to Evaluate Earnings Per Share
A company's EPS is a metric that helps investors measure how much net income a company generates per share. This is an important indicator of profitability.
There are several considerations involved in evaluating a company's EPS.
- A good EPS is not necessarily the highest EPS. The question to ask yourself is, "Is this level of income per share sustainable?" If the company's profitability isn't sustainable, you will likely see a decline in earnings per share over time on a quarter-over-quarter basis.
A decrease in earnings per share over time indicates growth that is not sustainable.
- Expectations for EPS depend on a company's industry and business model. If it takes time for a company's product or service to become profitable, then the earnings per share may not be as high because no income has been generated yet.
High-growth companies may trade publicly for years without causing positive EPS or EPS growth; that does not necessarily mean these are not trustworthy companies.
- EPS Trends are critical for a publicly-traded company. Investors like to see sustainable growth in earnings per share. Therefore, a company with a smaller EPS but the consistent growth is a positive sign of financial stability, while stagnant or declining reps could be a red flag for the market.

Limitations of Earnings Per Share
There are some limitations to the use of EPS as a metric. For example, net income is not always a good measure of profitability. It does omit non-cash items and can be manipulated through accounting methods. Additionally, it does not take into account the time value of money.
Investors need to be careful when interpreting EPS information for specific periods. The metric can be influenced by earnings due to one-time events or fluctuations in share price. More appropriate profitability ratios might include diluted EPS or adjusted EPS.
For these reasons, investors should also consider other profitability measures such as return on equity (ROE) and return on assets (ROA). Comparing various profitability ratios is an effective way to find profitability.
Price-to-Earnings (P/E)
The price-to-earnings (P/E) ratio is based on EPS. It is an important metric for investors because it tells them how much they need to pay per dollar of earnings. To find the P/E ratio, you divide the share price by a company's.
The P/E ratio is one of the most important metrics investors use. Relative to a company's competitors, a high P/E indicates a company's share price is overvalued, while a low P/E suggests the share price is undervalued.
EPS and Dividends
Dividends are a distribution of a company's earnings. The business can declare dividends to shareholders, or they could reinvest the money back into the company. The number of incomes a company receives will impact the dividends. A company with a high earnings per share is likely to pay generous dividends.

Negative EPS
A negative EPS indicates that the company is not making money. While negative EPS is alarming, look at the company's bigger picture. In the early development of the company, a negative EPS is expected.
The company is still expanding and setting up operations. But as the business develops, a positive EPS will become expected.
Due to negative EPS profitability implications, many investors are hesitant to invest in a company with a negative EPS. This is because a negative EPS tells investors a company is not currently profitable.

EPS Manipulation
Due to the significance of the EPS metric, it can be subject to manipulation through financial accounting techniques. Companies will attempt to mislead investors by adjusting financial metrics to portray better profitability in their EPS calculations. Some of these manipulation tactics include:
Adjusting Share Outstanding- Companies can buy back shares to increase the EPS. Shares Outstanding is in the denominator of the EPS equation. A company's EPS calculation will increase by buying back shares and lowering the denominator.
Deprecate Expenses Overtime- Management can decide to treat marketing and other soft costs as assets. If a new marketing project costs $100, then as an expense, it would lower earnings by $100. But if you said the project was a deprecation asset that depreciated over five years. The expense charge would only be $20.
Pension Manipulation- If a company offers a pension fund, it can be used as a source of manipulation. The excess can be added to net income if a company has an overfunded fund. This means that a company could artificially pad its net income without real changes to business operations.
These manipulation techniques for EPS are vital because they can lead to an artificial jump in a company's share price. In addition, finding a manipulation in EPS can help uncover market inefficiencies or an inappropriate valuation for a particular company.
Final Thoughts
It is a valuable metric used to understand the profitability of a company. Understanding how it is calculated and what value the EPS brings to investors is essential. It is used to know how much profit is available per share.

Everything You Need To Master Financial Statement Modeling
To Help You Thrive in the Most Prestigious Jobs on Wall Street.
Researched & Authored by Liam
Free Resources
To continue learning and advancing your career, check out these additional helpful WSO resources:

or Want to Sign up with your social account?