
Pareto Analysis
A decision-making technique

Updated:
September 15, 2022Pareto Analysis is a decision-making technique. Through this analysis, one can determine the root cause of any problem and evaluate and prioritize problems.
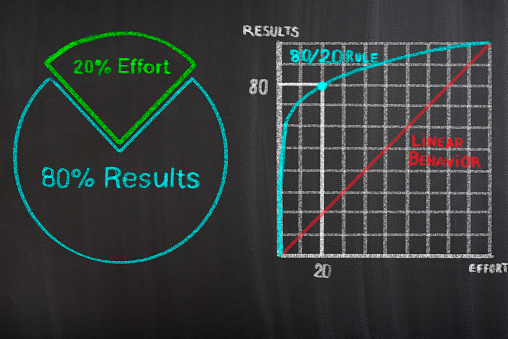
It is based on the "80-20" rule.
The "80-20 rule" dictates that 80% of the benefits of a project can be extracted through 20% of total work; similarly, 80% of the total problems can be associated with 20% of the causes.

In 1896, Vilfredo Pareto coined the term "80-20" rule in his book "Cours d'économie politique".
He discovered that 80% of Italy's total land was captured by just 20% of Italy's population. Upon extensive research, he could determine that the top 20% of the population held 80% of the country's total wealth.
Moreover, the wealth distribution was in the same proportion all across Europe.
It was only after almost 40 years in 1937 when an American business theorist Joseph Juran stumbled upon the research work of Vilfredo Pareto and, upon further exploring, renamed the '80-20 rule' as "Pareto's Principle of Unequal Distribution."
Juran later on extended the principle and discovered that it is applicable to the corporate world as well.
He realized that in quality control departments, 80% of problems that occurred during the manufacturing of faulty products could be solved by paying attention to the top 20% of the problems.
It can also be used in fields like economics, human resources, business management, customer handling, etc. the '80-20 rule' was made to explain the phenomena.
However, the figures are not definitive.
For instance, it is possible for one to reap 97% of the benefits by correcting only 3% of the problems. One could work on 5% of the problems and notice a 120% rise in sales.
Pareto Analysis came into existence only to show the disproportionate nature of the cause-and-effect relationships.
Terms Coined by Joseph Juran
Vital Few - it means that most problems can be traced back to a relatively small number of causes.
Trivial Many - refers to a large number of small causes that induce very few problems.
Steps for Pareto Analysis

Proper steps need to be followed in a synchronized order to reap the benefits of Pareto Analysis.
First and foremost, problems need to be listed to identify their causes so that the problems can be resolved by tweaking or changing the operations.
1. Identify the Problems- It is a decision-making and problem-solving technique. So, the first and foremost step to be undertaken for the analysis is the identification of all the problems that are occurring in the business operations.
There are various techniques that are used to list all the problems ranging from the biggest to the slightest inconvenience.
Communicating with people at all tiers of management and taking reviews from customers also help a lot.
2. List the Causes- once all the problems are identified, the next step is to find the variables that are causing them.
However, it is easier to find the root cause of the problems once all the problems are already listed.
It is possible to have multiple reasons behind one problem recurring. Moreover, one particular aspect could be inducing most of the problems too. The relationship becomes clear only after listing all the causes.

3. Prioritize the Problems- once the problems and reasons behind them are identified, they need to be prioritized.
Scores or rankings need to be allotted to each problem listed. The importance and ranks can be understood by taking input from team members, customers, etc.
The criteria to set the importance would depend on the nature of the problem. Problems could be judged in terms of their frequency of occurring, capital wasted, number of complaints by the customer, etc.
4. Group the Problems- this is the filtering stage. Business Organizations need to group problems similar to each other into one category.
It is done to narrow down their focus on the most problematic disruption in the entire business operations cycle.
5. Add up Scores- once the classification and grouping are done, scores given to each problem need to be added so that rankings can reflect those major problems stemming from the same root cause as the top priority of the business.
Final ranks can be determined through this process. It enables you to work on the main 20% of the problems to reap 80% of the benefits that one can avail of from a project.
6. Take Action- by this step, the major analyzing part is already done, and the problems that require immediate attention are already highlighted.
Now, organizations need to brainstorm and come up with solutions to the problems listed and then implement them as soon as possible.
Sometimes problems in the bottom ranks do not require attention due to their negligible effect on productivity.

Everything You Need To Master Financial Statement Modeling
To Help You Thrive in the Most Prestigious Jobs on Wall Street.
Pareto Chart
Pareto Chart fundamentally is just like any other bar graph/bar chart. It is one of the 7 Basic Quality Tools.
The bars here represent the frequency of the occurrence of the common problems that are interrupting optimum productivity. The bar graph follows a descending order (i.e., the longest bar will be located on the left and the shortest on the right.).
The chart is a graphical representation of the problems that enable you to understand and make other people see the problems that require attention and a permanent resolution immediately.
A line graph is also made on top of those bars to represent the cumulative percentage of problems.
Applications of Pareto Analysis

Pareto Analysis or the "80-20" rule has multiple uses in diverse situations in the modern business environment. Its diverse nature of it is just growing every day. The departments in business have increased drastically, and people try to pay attention to the tiniest aspect as well.
Due to this, business organizations have found methods to quantify their Data in such a way that it could be used everywhere. Following are a few instances: -
1. Business Management is the level from which Pareto Analysis entered the corporate world. It a manager's job to see which department/departments is/are affecting the business revenue the most.
If out of finance, marketing, human resource, public relations, and sales. The marketing department contributes the most to the total revenue.
The key takeaway is that the organization needs to focus on marketing to observe increased productivity.
2. Employee Contribution allows an organization to recognize and acknowledge the top 20% of employees whose efforts contribute to 80% of the total output.
It allows an organization to filter out their best employees and provide them incentives and rewards for their efforts.
The organization then also tries to motivate the other 80% of employees. Similarly, the least motivated 20% of employees would also be the root cause for 80% of human resource problems.
3. Customer Profitability Analysis- revenue depends a lot on customers. Pareto Analysis lets the business know the important 20% of customers that result in 80% of sales.
Once this information is known, the organization can then cater to the needs of this 20% section in a better way and focus on expanding its reach in the customer groups that form this 20%.
Moreover, they can also judge which customer group needs to be dropped completely as it is not generating sales equivalent to the expenditure made by the organization in order to satisfy them.

4. Pricing of Product- There needs to be a perfect balance between the costing, volume of sales, and total profit. Striking this balance becomes difficult if the organization is providing a variety of commodities to its customers.
The "80-20" rule enables them to find the top 20% of products that account for 80% of total sales.
Once the analysis is done, the team pays more attention to the pricing strategy of those top 20% products to maximize their profits.
5. Stock Control- the stock is managed through the ABC Analysis. Here products are categorized according to their consumption value, i.e., the total value of the product that is consumed in a certain period of time.
Category A is a list of all the products that are of the utmost importance to the organization.
Category B is a list of products that are relatively less important to the organization compared to Category A.
Category C includes products that are of the least importance.
The whole process of putting products into categories is made convenient and less time-consuming by the Pareto Analysis.
It lets an organization identify the products that only account for 20% of the total quantity but still make up 80% of the products' total value.

Although it is a very useful decision-making technique for businesses, its application is not just restricted to business. Medical professionals can use the principle to find the root cause of disease in any patient.
People can use the principles in their daily lives.
For instance, if a student is failing to score good marks in an exam. He can list the problems he faces while taking the test or preparing for it and then find the root causes.
Once he has ranked those causes, he will be able to figure out the changes he needs to make in his study pattern to perform better on the day of the test.

Everything You Need To Break into Venture Capital
Sign Up to The Insider's Guide by Elite Venture Capitalists with Proven Track Records.
Advantages of Pareto Analysis

1. Easy and Effective- it is a fundamental decision-making statistical technique. However, unlike other statistical techniques, managers do not need to have extensive clarity of statistical rules and formulas.
All one has to do is identify major problems and find the root cause of them. Once this is done, managers need to prioritize taking action against the causes that result in major problems recurring.
2. Problem Analysis- through this method, a proper analysis of the problem is achieved. Managers do not just identify the existing problems but can also trace them back to the activities or reasons they all started occurring in the first place.
How a problem can affect many departments can also be understood very clearly through this technique.
3. Decision-Making Traits- it enables you to identify the problems and their causes. However, it does not provide a tailor-made solution to all problems. Managers need to brainstorm to find a solution.
It only provides the organization with sufficient information to make a decision. The continuous brainstorming results in sharpened decision-making skills of the team involved in making a decision.
Disadvantages of Pareto Analysis

1. Based on Past Data- the analysis is entirely based on the data provided from past incidents and information. It does not take the unpredictability of the future into consideration.
Problems that occurred in the past may be outdated due to technological advancements or changes in operations.
Moreover, new problems can always come into existence due to the dynamic nature of any business environment.
2. Only Identifies Problems- It only helps in listing problems but does not provide solutions to them. This characteristic is both a boon and a bane.
Although it sharpens the decision-making skills of the management, it becomes a time-consuming procedure.
Moreover, decisions made are based on the judgment of the management. Therefore, they do not provide 100% accuracy.
3. Qualitative in Nature- it is highly qualitative in nature. It broadly classifies problems and enables the management to understand which problems need to be prioritized. Still, it is not much known for arithmetical accuracy.
Even the "80-20" rule is not set in stone, and the figures tend to change from situation to situation. One can never derive a quantifiable solution through the Pareto Analysis, unlike other statistical techniques.
4. Inaccuracy in Scoring- Problems, once identified, need to be scored or ranked. Problems with the highest scores are the problems that are dealt with first. Therefore, scoring problems is a very crucial step.
If problems are not scored correctly, then management could end up wasting time, money, and other resources on problems that do not require that level of attention. Needless to say, problems that are actually causing discrepancies will continue to exist.
The "80-20" rule will also not exist if the problems are ranked incorrectly.
Summary

Pareto Analysis is a great decision-making technique that is widely used in businesses. Businesses are developing and growing because of 7 basic quality tools (including the Pareto Chart).
This kind of analysis has several advantages. It gives the manager an objective perspective toward any issue recurring in the business. Although it is a statistical measure applying the Pareto analysis in real-time situations is simple.
Just like every coin has two sides, the analysis also has a few disadvantages. The analysis performed is based on the data collected in the past. Therefore, it does not take into account the problems that have developed in the recent past or can occur in the future.
It is not applicable only to identify problems, and it is also applicable in diverse situations, which is another great advantage of this statistical tool. It enables a manager to make several business decisions like pricing of a product, employee contribution, etc.
It has drawbacks but is still very useful in finding problems and ranking them. It allows managers to focus on and solve the most significant problems that will help them attain maximized returns. Any manager can easily use this as a strategic weapon in their operations.

Everything You Need To Build Your Accounting Skills
To Help You Thrive in the Most Flexible Job in the World.

or Want to Sign up with your social account?