
Relative Strength Index (RSI)
A leading indicator that oscillates between 0 and 100

Updated:
September 15, 2022The relative strength index is a momentum oscillator popular and widely used in technical analysis. It is a leading indicator that oscillates between 0 and 100.

It measures the rate of change of stock price movements and sets different market expectations based on the latest indicators readings.
It is one of the most common indicators that give strong signals during a sideways trend. While using this indicator, the main objective of traders is to interpret oversold or overbought regions in the market.
This article will explain how to interpret overbought and oversold regions.
Who invented it?
This indicator was invented by J. Welles Wilder and was introduced in his book -"New Concepts in Technical Trading Systems," published in 1978. Ever since it has gained a lot of popularity among readers and traders. Traders often make decisions based on strategies mentioned in his book.
Formula
The formula of the relative strength index and the method to calculate it is very simple; you have to follow certain steps, which are explained below:
RSI = 100 - (100/1+ RS)
Where RS = Average gain / Average loss
Average points gained = Total gain/ Total no. of days
Average points lost = Total loss/ Total no. of days

Now let's see it in detail with the help of an example
Let's assume the stock price of X Ltd. is 150 on 10/1/2022. Then, further data for 14 periods (days) is given below:
| Date | The closing price of each day | Points gained | Points Lost |
|---|---|---|---|
| 11/1/2022 | 154 | 4 | 0 |
| 12/1/2022 | 151 | 0 | 3 |
| 13/1/2022 | 150 | 0 | 1 |
| 14/1/2022 | 143 | 0 | 7 |
| 15/1/2022 | 148 | 5 | 0 |
| 16/1/2022 | 152 | 4 | 0 |
| 17/1/2022 | 155 | 3 | 0 |
| 18/1/2022 | 149 | 0 | 6 |
| 19/1/2022 | 145 | 0 | 4 |
| 20/1/2022 | 146 | 1 | 0 |
| 21/1/2022 | 148 | 2 | 0 |
| 22/1/2022 | 150 | 2 | 0 |
| 23/1/2022 | 146 | 0 | 4 |
| 24/1/2022 | 144 | 0 | 2 |
| TOTAL = 21 | TOTAL = 27 |
As you can see in this table, closing prices for the subsequent 14 days are taken, and we have calculated points gained or lost each day after looking at the previous day's closing price.
On 15/1/2022, for example, 5 points were gained. This was calculated by taking the previous day's closing price, i.e., 148 - 143 = +5. The + sign indicates points gained, and these are called updays. Updays are defined as days closing higher than the previous day's close.
Similarly, on 19/1/2022, 4 points were lost. This is calculated using the same method: 145-149 = -4, where a negative sign indicates points lost. Days where points are lost are called downdays. Downdays are defined as days closing lower than the previous day's close.
It is usually calculated using 14-period data.
Now we will be performing further calculations by taking values from above.
Average gain = 21/ 14 = 1.5
Average loss = 27 /14 = 1.92
RS = Average gain / Average loss
RS = 1.5 / 1.92 = 0.78
Hence , RSI = 100 - (100/1 + RS)
= 100 - ( 100/ 1 + 0.78) = 100 - ( 100/ 1.78)
= 100 - 56.17 = 43.83
Hence the final value of RSI = 43.83
What does it tell?
A graph represents the relative strength index. It oscillates between 0 to 100 with two horizontal lines, one on the top, usually at 70, and the second line on the bottom of the chart at 30.
The indicator is represented by a violet line which tells an investor the momentum of price movements in a given security.
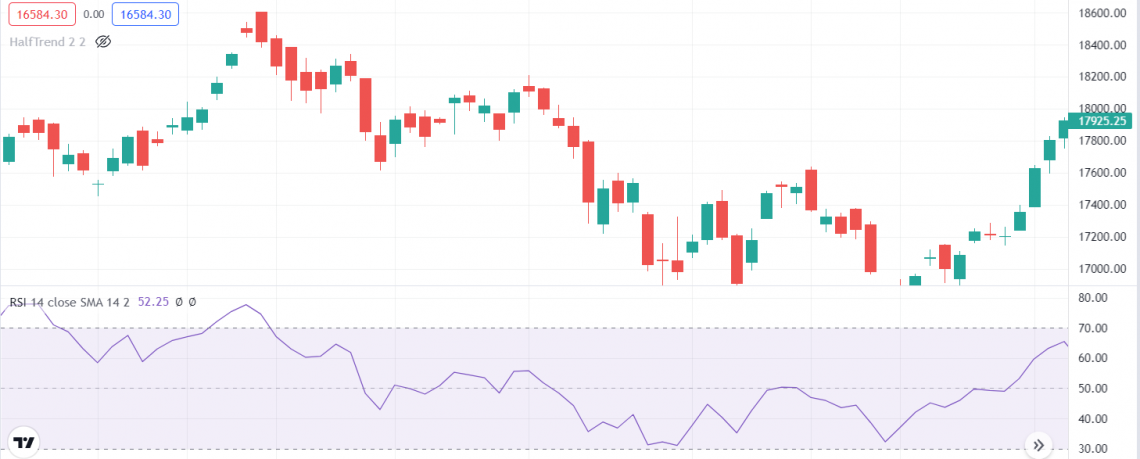
Traditionally, a value above 70 is considered an overbought or overvalued region. After a certain period, it generally shows reversals and leads to a downtrend.
The value below 30 is said to be oversold or undervalued, which means negative momentum is high, generally leading to market reversals and resulting in an uptrend.
A value between 30 and 70 is considered to be neutral, with 50 acting as a sign of a sideways trend.
Many traders often use a combination of candlestick patterns and indicators to get better outcomes, as sometimes, using this indicator independently can fail to give better results.
It rises as the number of points gained increases and falls as the number of points lost increases.
An indicator oscillates for an extended period. For example, if the value is above 70 for a long duration, it will create excess positive momentum. As a result, the market might continue to be uptrend as traders look for buying opportunities rather than selling.
Similarly, it will create excess negative momentum when it is below 30 for an extended period. As a result, the market will most likely continue to be downtrend as traders start looking for selling opportunities rather than purchasing.
It might be a little confusing initially, but we suggest you practice more by reading different charts and trying to backtest your strategies before moving ahead. Despite being one of the most popular technical indicators, it sometimes fails to predict accurately.
You can also check this youtube video for better clarification:
Relative Strength Index Divergences and Swing Rejections
Divergence within RSI through price movements is a powerful indication that there will be reversals in the market.
There are two types of divergences: bullish divergences and bearish divergences.
1) Bullish divergence: This is created when RSI is in the oversold region (i.e., below the 30 mark), and it makes a higher low while price makes a lower low correspondingly. This indicates positive momentum is rising, and it might be wise to enter a long position.
2) Bearish divergence: This is created when RSI is in the overbought region (i.e., above the 70 mark), and it makes a lower high while price makes a higher high correspondingly. It indicates negative momentum is rising, and one should consider entering a short position.
You can also check out this YouTube video for clarification:
Swing rejections
Another technique used in trading is swing rejections. There are two types of swing rejections: bullish swing rejections and bearish swing rejections.
1) Bullish swing rejections: The RSI should be in the oversold region and cross 30. Afterward, it should form another low close to 30 and then break out and create a new high. This results in an uptrend or bullish trend.
2) Bearish swing rejections: The RSI should be in the overbought region and then go down below 70. Afterward, it should form another high close to 70 and then break out and create a new low. This results in a downtrend or bearish trend.
What are the best settings for RSI?
It is usually calculated by taking 14-period data as a standard size. J. Welles Wilder takes data of 14 days for calculation as it gives the best results for his purposes. It can, however, be tweaked and changed as per your needs.

Some investors use 15, 20, 70, or even 100 days of data to calculate the index. We encourage you to experiment with different combinations and see what works best for you.
Relative Strength Index and FOREX
An intraday forex trading strategy can be used to interpret the indications from the index and other technical indicators that a market is overvalued or undervalued. A value above 70 is said to be overbought, and a value below 30 is said to be oversold.

This index is a widely used technical indicator in forex trading and helps to identify entry and exit points within a short period. It is not only for forex but also used while trading other securities like stocks, futures, and options.
A combination of technical indicators and candlestick patterns can be used to get better results.
FAQs
After the indicator has been moving away from an oversold index value, i.e., 30, for a long time, you can begin looking for buying opportunities.
Also, when it is above 70 for an extended period, look for buy signals as it might continue to be in the overbought region due to excess positive momentum.
After the indicator has been moving away from an overbought index value, i.e., 70, for a long time, you can begin looking for selling opportunities.
Alternatively, when it is below 30 for an extended period, look for sell signals as it might continue to be oversold due to excess negative momentum.
They both are momentum indicators that are widely used in technical analysis. MACD determines the strength of stock price movement, while RSI helps us to tell the difference between the overbought and oversold regions.
Sometimes this indicator fails to give robust results, as market reversals are sometimes difficult to predict, and some investors enter the wrong positions. A combination of candlestick patterns and indicators can be used to create better outcomes.
An uptrend is also known as a bullish trend. It is observed when the price makes higher highs and higher lows. In this, the trader expects the security's price to go up.
Or
When peaks and troughs move in an ascending direction, it is known as an uptrend.
A downtrend is also known as a bearish trend. It is observed when the price makes lower highs and lower lows. In this, the trader expects the security's price to go down.
Or
When peaks and troughs move in a descending direction, it is known as a downtrend.
Leading indicators are those which precede the price movement of a stock or security and give indications before the occurrence of an event. The relative strength index is one of the most popular leading indicators. It helps traders to identify early signals to execute trades.

Everything You Need To Build Your Accounting Skills
To Help You Thrive in the Most Flexible Job in the World.

or Want to Sign up with your social account?